MATH 225N Week 8 Assignment; Predictions Using Linear Regression (v2)
-
$10.00
| Institution | MATH 225N Statistical Reasoning for the Health Sciences |
| Contributor | Gbenga |
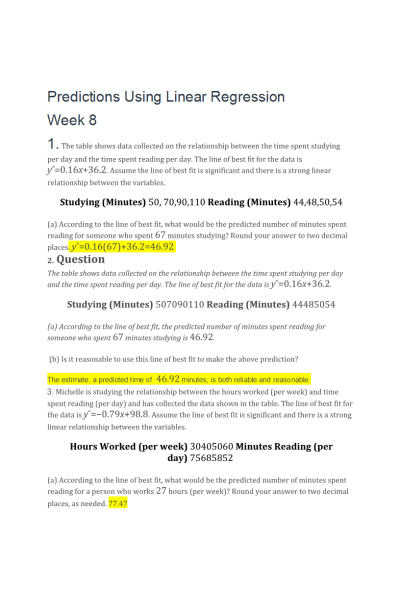
- Question: The table shows data collected on the relationship between the time spent studying per day and the time spent reading per day. The line of best fit for the data is yˆ=0.16x+36.2. Assume the line of best fit is significant and there is a strong linear relationship between the variables.
Studying (Minutes) 50, 70,90,110 Reading (Minutes) 44,48,50,54
According to the line of best fit, what would be the predicted number of minutes spent reading for someone who spent 67 minutes studying? Round your answer to two decimal places.
- Question: The table shows data collected on the relationship between the time spent studying per day and the time spent reading per day. The line of best fit for the data is yˆ=0.16x+36.2.
Studying (Minutes) 507090110 Reading (Minutes) 44485054
According to the line of best fit, the predicted number of minutes spent reading for someone who spent 67 minutes studying is 46.92.
Is it reasonable to use this line of best fit to make the above prediction?
- Question: Michelle is studying the relationship between the hours worked (per week) and time spent reading (per day) and has collected the data shown in the table. The line of best fit for the data is yˆ=−0.79x+98.8. Assume the line of best fit is significant and there is a strong linear relationship between the variables.
Hours Worked (per week) 30405060 Minutes Reading (per day) 75685852
According to the line of best fit, what would be the predicted number of minutes spent reading for a person who works 27 hours (per week)? Round your answer to two decimal places, as needed.
- Question: Michelle is studying the relationship between the hours worked (per week) and time spent reading (per day) and has collected the data shown in the table. The line of best fit for the data is yˆ=−0.79x+98.8.
- Hours Worked (per week) 30405060 Minutes Reading (per day) 75685852
According to the line of best fit, the predicted number of minutes spent reading for a person who works 27 hours (per week) is 77.47.
Is it reasonable to use this line of best fit to make the above prediction?
| Instituition / Term | |
| Term | Fall 2020 |
| Institution | MATH 225N Statistical Reasoning for the Health Sciences |
| Contributor | Gbenga |


