MATH 225N Week 8 Assignment; Predictions Using Linear Regression
-
$20.00
| Institution | MATH 225N Statistical Reasoning for the Health Sciences |
| Contributor | Patricia |
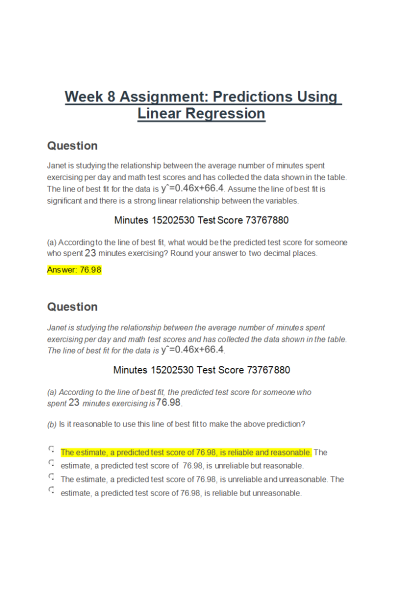
- Question: Janet is studying the relationship between the average number of minutes spent exercising per day and math test scores and has collected the data shown in the table. The line of best fit for the data is yˆ=0.46x+66.4. Assume the line of best fit is significant and there is a strong linear relationship between the variables.
Minutes 15202530 Test Score73767880
(a) According to the line of best fit, what would be the predicted test score for someone who spent 23 minutes exercising? Round your answer to two decimal places.
- Question: Janet is studying the relationship between the average number of minutes spent exercising per day and math test scores and has collected the data shown in the table. The line of best fit for the data is yˆ=0.46x+66.4.
Minutes 15202530 Test Score 73767880
- According to the line of best fit, the predicted test score for someonewho spent 23 minutes exercising is76.98.
- Is it reasonable to use this line of best fit to make the aboveprediction?
- Question: Michelle is studying the relationship between the hours worked (per week) and time spent reading (per day) and has collected the data shown in the table. The line of best fit for the data is yˆ=−0.79x+98.8. Assume the line of best fit is significant and there is a strong linear relationship between the variables.
Hours Worked (per week) 30405060 Minutes Reading (per da y) 75685852
(a) According to the line of best fit, what would be the predicted number of minutes spent reading for a person who works 27 hours (per week)? Round your answer to two
decimal places, as needed.
- Question: Michelle is studying the relationship between the hours worked (per week) and time spent reading (per day) and has collected the data shown in the table. The line of best fit for the data is yˆ=−0.79x+98.8.
- Hours Worked (per week) 30405060 Minutes Reading (per da y) 75685852
- According to the line of best fit, the predicted number of minutes spent reading for a person who works 27 hours (per week) is77.47.
- Is it reasonable to use this line of best fit to make the above prediction?
- Question: Jeremy is studying the relationship between the average number of minutes spent exercising per day and math test scores and has collected the data shown in the table. The line of best fit for the data is yˆ=0.5x+67.0. Assume the line of best fit is significant and there is a strong linear relationship between the variables.
Minutes 20253035 Test Score77808185
(a) According to the line of best fit, what would be the predicted test score for someone who spent 18 minutes exercising? Round your answer to two decimal places, as necessary.
- Question: Jeremy is studying the relationship between the average number of minutes spent exercising per day and math test scores and has collected the data shown in the table. The line of best fit for the data isyˆ=0.5x+67.0.
Minutes 20253035 Test Score 77808185
- According to the line of best fit, the predicted test score for someonewho spent 18 minutes exercising is76.
- Is it reasonable to use this line of best fit to make the aboveprediction?
| Instituition / Term | |
| Term | Summer 2021 |
| Institution | MATH 225N Statistical Reasoning for the Health Sciences |
| Contributor | Patricia |


