MATH 225N Week 8 Assignment; Linear Regression Equations
-
$25.00
| Institution | MATH 225N Statistical Reasoning for the Health Sciences |
| Contributor | Patricia |
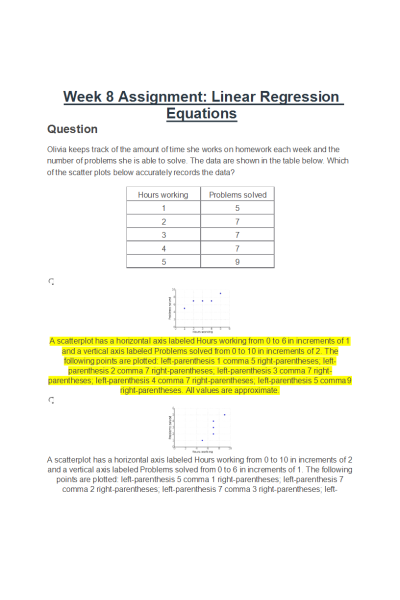
- Question: Olivia keeps track of the amount of time she works on homework each week and the number of problems she is able to solve. The data are shown in the table below. Which of the scatter plots below accurately records the data?
- Question: The scatter plot below shows data relating total income and the number of children a family has. Which of the following patterns does the scatter plot show?
- Question: Rosetta owns a wedding photography business. For each wedding, she
charges $100 plus $50 per hour of work. A linear equation that expresses the total amount of money Rosetta earns per wedding is y=50x+100. What are the independent and dependent variables? What is the y-intercept and the slope?
- Question: Lexie owns a lawn mowing service. For each lawn, she charges $85 plus $20 per hour of work. A linear equation that expresses the total amount of money Lexie earns per lawn is y=85+20x. What are the independent and dependent variables? What is the y-intercept and the slope?
- Question: Which of the following lines has a negative slope? Select all correct answers.
- Question: Which of the following are linear equations? Select all correct answers.
- Question: Ethan repairs household appliances like dishwashers and refrigerators. For each visit, he charges $25 plus $20 per hour of work. A linear equation that expresses the total amount of money Ethan earns per visit is y=25+20x.
What are the independent and dependent variables? What is the y-intercept and the slope?
- Question: Alice owns a snow shoveling business. For each driveway, she
charges $50 plus $70 per hour of work. A linear equation that expresses the
total amount of money Alice earns per driveway is y=70x+50. What are the independent and dependent variables? What is the y-intercept and the slope?
- Question: Find the graphs below which have a positive slope. Select all correct answers
- Question: Which of the following lines has slope zero? Select all correct answers.
- Question: The scatter plot below shows data relating competitive chess players' ratings and their IQ. Which of the following patterns does the scatter plot show?
- Question: The scatter plot below shows data relating competitive chess players' ratings and their IQ. Which of the following patterns does the scatter plot show?
- Question: Horace keeps track of the amount of time he spends practicing his tennis serve and the number of aces he gets in his match each week. The data are shown in the table below. Which of the scatter plots below accurately records the data?
- Question: An owner of multiple online clothing stores explored the relationship between the percent of on-call service representatives and the percent of purchases over $75 at the same stores. The owner collects information from 6 of their online stores, shown in the table below.
Use the graph below to plot the points and develop a linear relationship between the percent of on-call service representatives and the percent of purchases over $75.
- Question: Using the linear relationship graphed above, estimate the percent of over $75 purchases if there are 40% on-call service representatives.
| Instituition / Term | |
| Term | Summer 2021 |
| Institution | MATH 225N Statistical Reasoning for the Health Sciences |
| Contributor | Patricia |


