MATH 225N Week 5 Lab Assignment
-
$20.00
| Institution | MATH 225N Statistical Reasoning for the Health Sciences |
| Contributor | Egreta Stone |
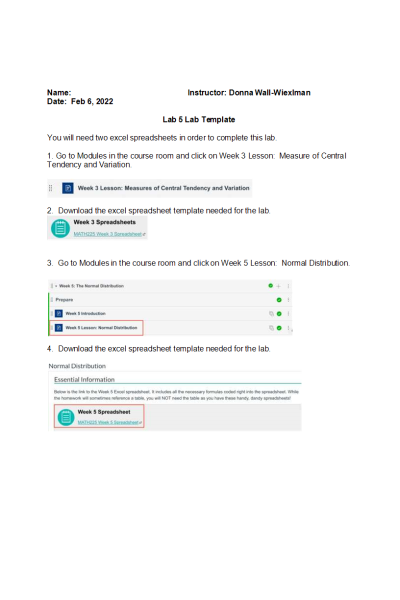
You will need two excel spreadsheets in order to complete this lab.
- Go to Modules in the course room and click on Week 3 Lesson: Measure of Central Tendency and Variation.
- Download the excel spreadsheet template needed for the lab.
- Go to Modules in the course room and click on Week 5 Lesson: Normal Distribution.
- Download the excel spreadsheet template needed for the lab.
- Create a description spreadsheet to describe the 10 participants surveyed and provide the screen shot below.
- How did you choose the participants for your study (sampling method)? Give details of how you collected the 10: I chose this sample of students from my daughter’s schools which is a public school of 921 students, 241 of those students are in the senior class. This group includes those students who have identified themselves as male/female. I am using the cluster sampling method. I know this is the correct method because I am taking a group of seniors from one school and am breaking them into clusters and am including all members in the sample.
- What part of the country did your study take place in? Tucson, Arizona
- What are the age ranges of your participants? Age range is 16-18
- How many of each gender did you have in your study? 7 Male & 13 Female
- What are other interesting factors about your group?
- This group of students are from a public unified school district and are of varied races and socio-economic backgrounds. These students were randomly selected from Sabino High School which is ranked 61st within Arizona. Student- Teacher ratio 23:1. Advanced placement participation is 48%. The total minority enrollment is 49%, and 31% of students are disadvantaged. There are 241 seniors at Sabino High School.
- Create a description spreadsheet to describe the 10 participants surveyed and provide the screen shot below.
- Take a Screenshot of your Preliminary Calculations (Week 3 Spreadsheet) and provide it below. Please list the 10 heights your professor provided first followed by the 10 heights you collected. There should be 20 values to determine the mean and sample standard deviation.
.
- How does your height compare to the mean (average) height of the 20 values? Is your height more, less, or the same as the mean of your group?
Empirical Rule
Determine the 68%, 95%, and 99.7% values of the Empirical Rule in terms of the 20 heights of your study.
--Take a Screenshot of your Empirical Rule Sheet (Week 5 Spreadsheet) and provide it below
What do these values tell you? Write complete sentences explaining what the values in the Empirical Rule tell you in context of the data.
Normal Distribution
--Take a Screenshot of your Normal Distribution Sheet and provide it below
Based on your study results, what percent of the study participants are shorter than you? What percent are taller?
| Instituition / Term | |
| Term | Year 2022 |
| Institution | MATH 225N Statistical Reasoning for the Health Sciences |
| Contributor | Egreta Stone |


