MATH 225N Week 3 Assignment; Quartiles and Box Plots
-
$25.00
| Institution | MATH 225N Statistical Reasoning for the Health Sciences |
| Contributor | Patricia |
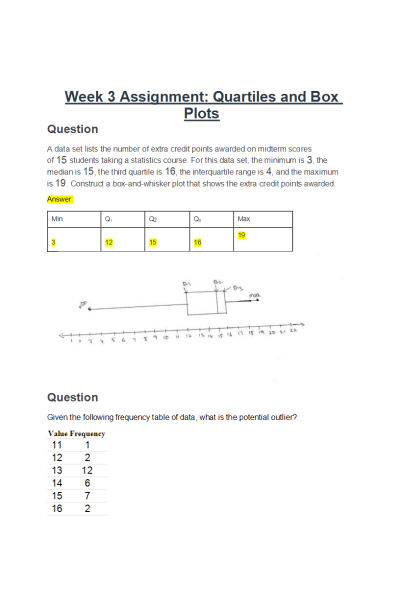
- Question: A data set lists the number of extra credit points awarded on midterm scores
of 15 students taking a statistics course. For this data set, the minimum is 3, the median is 15, the third quartile is 16, the interquartile range is 4, and the maximum is 19. Construct a box-and-whisker plot that shows the extra credit points awarded.
- Question: Given the following frequency table of data, what is the potential outlier?
- Question: A data set lists the number of times each student raised their hand during an algebra class. For this data set, the minimum is 1, the first quartile is 8, the median is 10, the inter quartile range is 3, and the maximum is 13. Construct a box-and-whisker plot that shows the number of times students raised their hand.
- Question: The following frequency table summarizes a set of data. What is thefive-number summary?
- Question: The five number summary for a set of data is given below. What is the interquartile range of the set of data?
- Question: The five number summary for a set of data is given below. Using the interquartile range, which of the following are outliers? Select all correct answers
- Question: The following frequency table summarizes a set of data. What is thefive-number summary?
- Question: The following frequency table summarizes a set of data. What is the five-number summary?
- Question: The following frequency table summarizes a set of data. What is the five-number summary?
- Question: According to U.S. climate data, the monthly average high temperatures, in degrees Fahrenheit, for the city of Chicago are listed below.
32,34,43,55,65,75,81,79,73,61,47,36
Find the five-number summary for this data.
- Question: The following frequency table summarizes a set of data. What is the five-number summary?
- Question: The five number summary for a set of data is given below. What is the interquartile range of the set of data?
- Question: The five number summary for a set of data is given below. Using the interquartile range, which of the following are outliers? Select all correct answers.
- Question: A data set lists the number of times a machine breaks each month in a clothing factory over the past year. For this data set, the minimum is 4, the median is 14, the third quartile is 17, the interquartile range is 6, and the maximum is 18. Construct a box-and-whisker plot that shows the number of times the machine breaks.
- Question: A data set lists the number of daily emails received by employees at an office over the past few months. For this data set, the minimum is 1, the first quartile is 2, the median is 4, the third quartile is 5, and the maximum is 13. Construct a box-and-whisker plot that shows the number of emails.
- Question: Based on the box-and-whisker plot from the solution above, what is the interquartile range of the data?
| Instituition / Term | |
| Term | Summer 2021 |
| Institution | MATH 225N Statistical Reasoning for the Health Sciences |
| Contributor | Patricia |


