MATH 225N Week 2 Knewton Homework Assignment; Stem and Leaf plots (Section 2.1)
| Institution |
Chamberlain |
| Contributor |
Maureen |
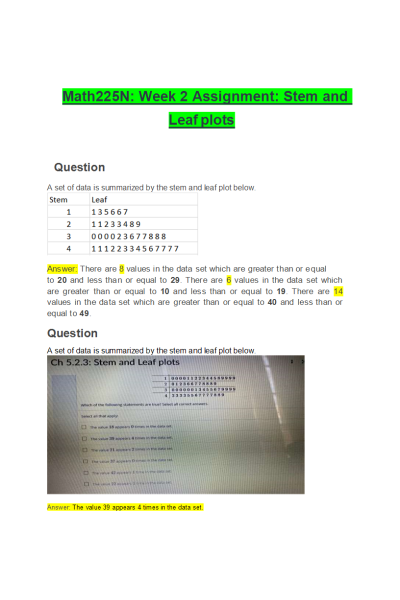
- Q: A set of data is summarized by the stem and leaf plot below.
- Q: A set of data is summarized by the stem and leaf plot below.
- Q: A set of data is summarized by the stem and leaf plot below.
- Q: Which data set is represented by this stem-and-leaf plot?
- Q: The ages of United States' presidents inaugurated in the 20th century are summarized by the stem and leaf plot below.
- Q: Which of the following statements are true? Choose all answers that apply.
- Q: A set of data is summarized by the stem and leaf plot below.
- Q: A set of data is summarized by the stem and leaf plot below.
- Q: A set of data is summarized by the stem and leaf plot below.
- Q: A set of data is summarized by the stem and leaf plot below.
- Q: The data below shows the stem and leaf plot of the number of counties in some U.S. states in 2013.
- Q: Which of the following statements are true? Select all that apply
- Q: A set of data is summarized by the stem and leaf plot below.
- Q: A set of data is summarized by the stem and leaf plot below.
| Instituition / Term |
| Term |
Uploaded 2023 |
| Institution |
Chamberlain |
| Contributor |
Maureen |


