MATH 225N Week 2 Assignment; Frequency Tables and Histograms
-
$25.00
| Institution | MATH 225N Statistical Reasoning for the Health Sciences |
| Contributor | Patricia |
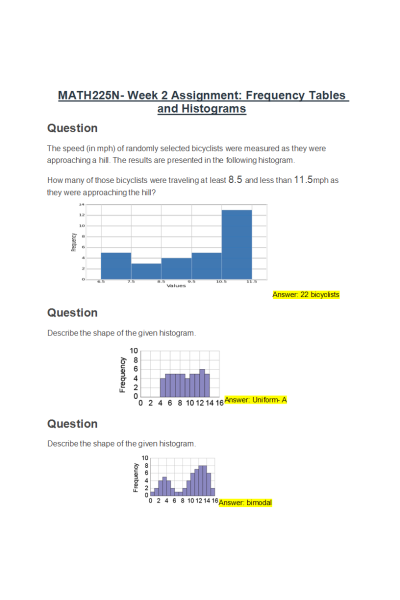
- Question: The speed (in mph) of randomly selected bicyclists were measured as they were approaching a hill. The results are presented in the following histogram.
How many of those bicyclists were traveling at least 8.5 and less than 11.5mph as they were approaching the hill?
- Question: Describe the shape of the given histogram.
- Question: Describe the shape of the given histogram.
- Question: The students in a first-grade class were all asked to time how long (in seconds) they could hold their breath. The results were tallied and are presented in the following histogram.
How many of those students held their breath greater than 12.5 and less than 15.5 seconds?
- Question: Several people were asked to report the number of hours of sleep they average per night. The results are shown in the histogram below. How many of those people average greater than 4.5 and less than 6.5hours of sleep per night?
- Question: Given the following histogram for a set of data, how many values in the data set are greater than 5.5 but less than 8.5?
- Question: Given the following histogram for a set of data, how many values in the data set are greater than 10.5 and less than 12.5?
- Question: A professor gave students a test, and the distribution of the scores of the students is shown in the histogram below. What shape does the distribution have?
- Question: Describe the shape of the given histogram.
- Question: A professor gave students a test that was easier than usual. The distribution of the scores of the students is shown in the histogram below. What shape does the distribution have?
- Question: Describe the shape of the given histogram.
- Question: A restaurant is open for both lunch and dinner. One day, the owner kept track of the number of occupied tables in the dining area and created a histogram showing the results for each half hour of the day. What shape does the distribution have?
- Question: The histogram shows the income of the families of the students in a statistics class. What is the shape of the histogram?
- Question: A student surveys his class and creates a histogram showing the number of pets in each student's house. What is the shape of the distribution?
- Question: The histogram below represents the prices of digital SLR camera models at a store. Describe the shape of the distribution.
- Question: A professor created a histogram showing the birth month of the students in one of her classes. What is the shape of the histogram?
- Question: A bookstore took an inventory of the prices of its books and created a histogram to show the results. What shape does the distribution have?
- Question: Describe the shape of the given histogram.
- Question: Describe the shape of the given histogram.
| Instituition / Term | |
| Term | Summer 2021 |
| Institution | MATH 225N Statistical Reasoning for the Health Sciences |
| Contributor | Patricia |


